Showing posts with label Premier League. Show all posts

Friday, 13 May 2016

Is it better to be patient or to take long shots?

Watching a lot of Celtic games recently got me thinking about how they play, why Ronny Deila has come under so much pressure and why they are different to many of the other sides who dominate their respective leagues.
The answer struck me when watching Barcelona versus Atletico Madrid in the first leg of their Champions League Quarter-Final.
Despite facing ten men and with Atletico sitting very deep Barcelona kept the ball and continued to try and work positions for Great and Good Chances, which have a significantly higher conversion rate than Attempts.
While I am in no way comparing Celtic to Barcelona in terms of quality, they do face similar problems when playing domestically. Opponents tend to sit deep and be very compact against them, allowing them to control the ball 30 or 40 yards out and restricting the space in behind. However, in contrast to Barcelona I had observed that Celtic are very happy to have lots of Attempts, sacrificing the possibility of creating better chances by keeping the ball.
This led to further thoughts about how Attempts might affect the Total Goals Line in games. Given the conversion rates for Great and Good Chances it means that leagues with more of these should have higher starting lines. Indeed, I would expect to see a trend where games with low lines have a higher proportion of Attempts than Great or Good Chances.
The graphic below shows the difference in the most common total goals line across 15 competitions covered by StrataBet. These competitions are generally taken from the start of the 2015/16 season to date, though Japan J League and Norway Eliteserien look at the entire 2015 season:
Patience or Long Shots Chart 1-01
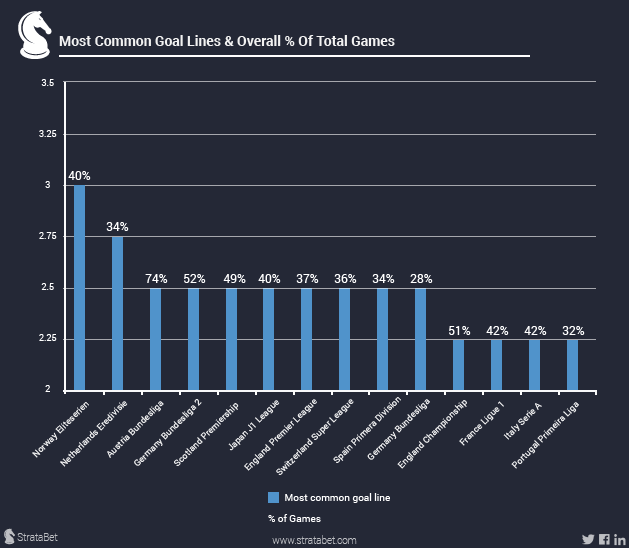
From this table it is easy to see that Norway has a much higher goal line than the English Championship, meaning that more goals would be expected to be scored in their games.
If more goals are expected, then the proportion of Great and Good Chances should also be higher to account for this.
Using StrataData I investigated this theory and there does appear to be some correlation. Of the leagues with low goal lines, three of the four lowest (those with 2.25 as the common line) also appear as three of the four lowest in terms of the number of Attempts per Great Chance created:
Patience or Long Shots Chart 2-01
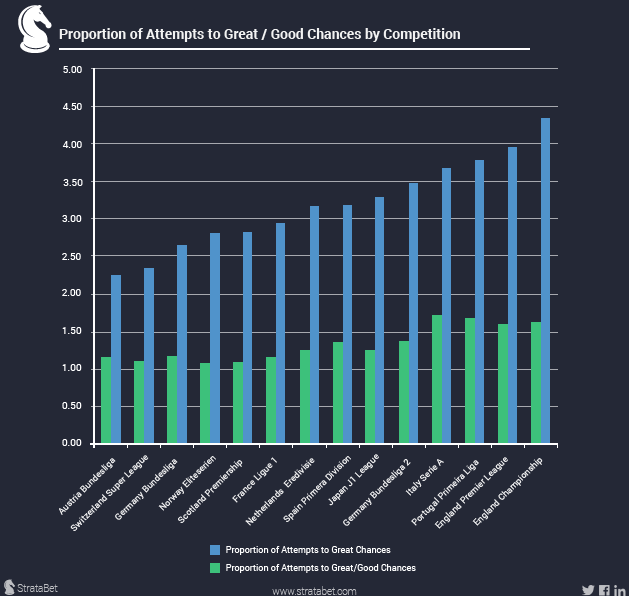
The outlier here is France Ligue 1, where Great Chances are created but the goal lines are low and the fewest goals per game are scored of the big five leagues.
The English Premier League and Championship also fall into this category, but in the Premier League 32% of games had a goal line of 2.25. The difference between that and the most frequent of 2.5 (37%) is a relatively small amount, making this understandable.
Austria, Switzerland and Germany Bundesliga appear to be the polar opposite of this, with fewer Attempts taken and more Great Chances created. This fits well in Switzerland, with 64% of games having a starting goal line of >2.5 and 49% of German Bundesliga games having the same.
The graphic below shows this in more detail, so that we can see the leagues where more goals are expected on a regular basis:
Patience or Long Shots Chart 3-01
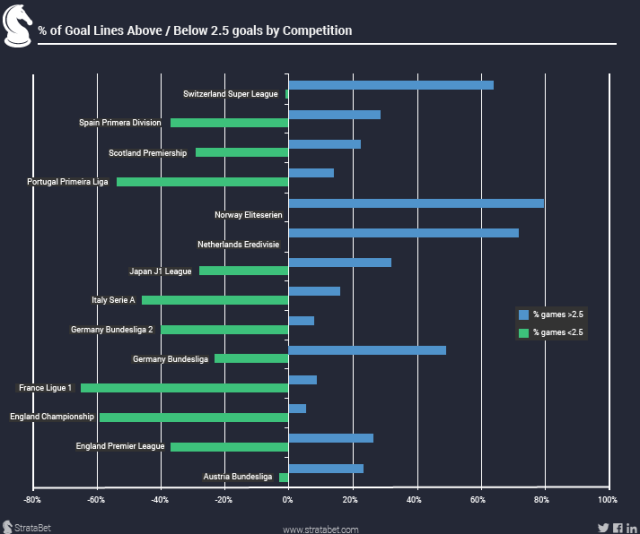
Germany and Switzerland are only behind Netherlands and Norway in terms of the number of games where over 2.5 goals would be expected.
So how does this relate back to Celtic?
Looking at teams who dominate their league we can see if they typically play like Barcelona in terms of keeping the ball and waiting for better chances, or if they simply shoot often and from wherever possible.
For this I have chosen teams from the top three of all the leagues mentioned who are at least 15 points clear of the team in fourth and the table below brings up some interesting points to note:
patience or longshots table 4-01
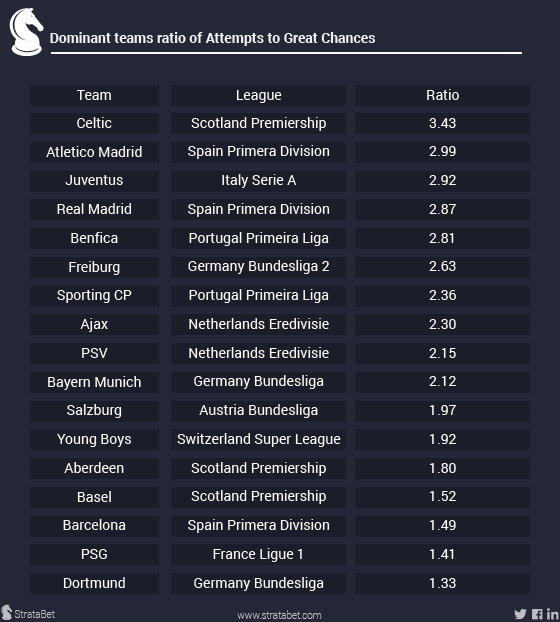
As suspected, Celtic lead this table by quite a distance from the rest. For every Great Chance they create they have ~3.5 Attempts, which is significantly more than Barcelona, Dortmund and PSG, who have ~1.5 Attempts per Great Chance.
This does not necessarily mean what Celtic are doing is wrong, but the question would be is this repeatable? We would expect the number of Attempts Celtic have had to result in ~6 goals, though they have actually scored 14. This says that they are either lucky and doing better than we’d expect or that they are confident the quality of strike they can produce from poor positions can beat the quality of goalkeeper the opposition has.
Ultimately there is no singular proven way of playing successful football regardless of personnel. Surprisingly it is Juventus who lead this list of teams if you include the number of Attempts taken compared to both Great AND Good Chances created, despite being a fantastic side. However, what it does show is the style that teams like to play in:
patience or longshots tabke 5-01
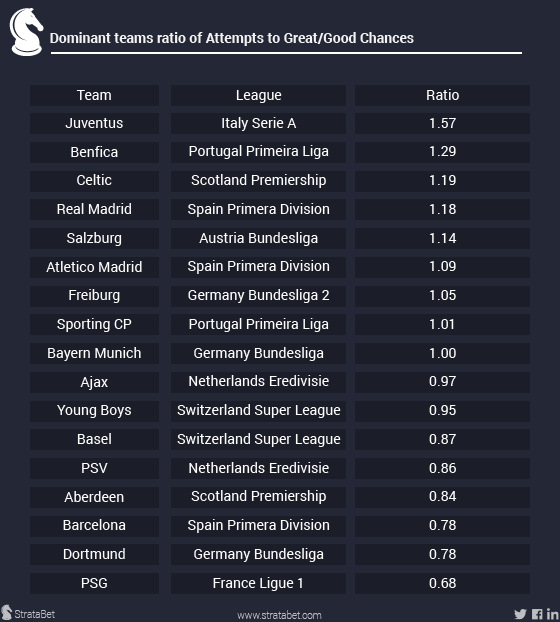
The teams at the lower end are more content to wait for better chances to come, knowing that they have the quality to keep creating rather than taking longer shots. The teams at the higher end are apparently confident in their ability to shoot from range, which can be a useful tactic in many situations. It can keep opponents guessing and also opens up opportunities for strikers to get on the end of rebounds and to win more corners.
What should be noted here is that almost all the teams in these tables are at the top end of creating Great and Good Chances in each of their respective leagues. As such, even though they may be registering a lot of Attempts they are still creating better quality chances on a regular basis than most other teams in their league.
Of course Attempts are not always a bad thing but teams that favour these over Great and Good Chances may struggle when the standard of opposition increases, such as in European competition when chances can often be at a premium. Celtic are the prime example of this as they dominate the Scottish Premiership but have failed to make much of a dent during their recent Champions League and Europa League campaigns.
It will be interesting to see how much Ronny Deila’s successor changes their style of play and attitude towards chance creation and if this improves their fortunes on the grander stage.
This blog was originally available at StrataBet Trading Expert.

Friday, 15 April 2016

Who will make the Championship Play Offs?

This blog was originally posted on StrataBet Trading Expert (08/04/16)
The English Championship continues to be a fiercely competitive division. At the top end of the table the recent poor form of Hull and Middlesbrough has created what now looks to be a four-way fight for the two automatic promotion spots. At the bottom the recent resurgence of Rotherham under Neil Warnock has given them a great chance of avoiding relegation. Bolton and Charlton look doomed, but there are other teams who could still be dragged into the fight. Indeed, MK Dons look set to join them after poor results in their last two games.
The focus of this piece will be the race for the two remaining play-off places. Derby secured an excellent victory over Hull on Tuesday and it looks like four teams will be competing for two places, just like in the race for automatic promotion. Birmingham seemed to be in contention before the weekend but defeats to Charlton and Brighton have left them facing an almost insurmountable task, despite the fact that they have a game in hand.
The Contenders
Screenshot 1 - Current Positions
Sheffield Wednesday
After a huge improvement last season under Stuart Gray, this season saw a new and largely unheard of manager Carlos Carvalhal arrive, and with the backing of fresh investment Wednesday have been excellent this season. Their aim at the beginning of the campaign was a top half finish, but it will now be disappointing if they don’t make the top six. They have a squad high on quality but they can be overly reliant on the talismanic Fernando Forestieri, with few players capable of acting as a direct replacement. Wednesday have a very strong spine and will be the favourites to finish sixth.
Derby have history with missing out on the play-offs after last season’s dismal finish and they will be determined not to let the same happen again. They have already had a bad spell this term when they dropped from first to fifth and Paul Clement was sacked after less than eight months in charge. Despite sound bites from the club that promotion is not their primary aim they will not want to miss out, but need to get the team playing a cohesive style. They can often look disjointed and tend to struggle against more physical sides.
While Cardiff fans have recently had a taste of the Premier League they have emerged as unexpected challengers this season after cost cutting seemed to hinder any kind of push. Resentment towards owner Vincent Tan, plus a general dislike of Russell Slade and his style of play seems to have diminished slightly as a togetherness within the team has seen them only lose twice at home all season. Their lack of strikers could be their major downfall in the end, but they have been able to spread the goals around the team so far.
Having missed out on the 2014/15 play-off final after losing to local rivals Norwich in the semi-final, another shot at the top six was the aim for this campaign. Despite losing key players like Tyrone Mings and with very little investment Mick McCarthy has again worked wonders to get them competing at the top end of the division. Their style of play is still direct and aggressive, but there is perhaps not quite as much long ball play as there was last season and they still remain effective. Daryl Murphy remains their most dangerous player, but he has regressed from last season when he hit an unprecedented 27 goals, which was more than his total in the previous four years combined. Murphy’s saving grace is that he adds a lot of value to the team even when not scoring, so Ipswich will hope the injury he picked up on international duty is a minor one.
Sheffield Wednesday ~1.11
Cardiff City ~4.5
Ipswich Town ~15.0
5th-12th placed opposition – Draw
13th-18th placed opposition – Win
19th-24th placed opposition (home) – Win
19th-24th placed opposition (away) – Draw
6th – Derby County (74pts)
7th – Cardiff City (73pts)
8th – Ipswich Town (70pts)

Derby County
Cardiff City
Ipswich Town
Schedule
As shown in the table below the teams face run-ins of various difficulties. On paper it appears that Ipswich have the hardest set of fixtures with three away games against current top six sides, all coming in the final five games of the campaign. Cardiff have just come through a tough spell against teams in the top six themselves and took a very respectable four points:
Upcomming fixtures2.png
It should be noted that because Sheff Wed and Derby currently reside in the play-offs they obviously count as members of the top six. Wednesday still have all three play-off rivals to face, with two of these games being at home, and it is these three games that should be most vital. Derby have perhaps the easiest run in of the four sides, purely due to their games against teams in the bottom six.
Ipswich’s trio of difficult away games sandwich two games at home against teams in the bottom three. While this may seem like a massive bonus, at this stage of the season it may actually be a huge banana skin compared to playing a mid-table side with nothing to play for. This was shown on Tuesday night when they struggled at home to a determined Charlton side.
In previous seasons 70 points has been seen as the benchmark needed to make the top six. However, this would only have seen a team make the play-offs in three of the last ten seasons:
previous points needed for 6th place.png
75 points actually seems a much more reasonable target, especially with the number of teams chasing down the play-off spots. 75 Points would be enough in nine of the last ten seasons, with only last season throwing up an anomaly as Wolves (78 points) and Derby (77 points) both missed out. These were the highest totals to do so since the Championship switched to its current format of 24 teams in the late 80’s.
StrataData
Using StrataData we can look at some key indicators as to how each of the teams have performed over the season:
Table 3 CHANCE VOLUME1.png
From this we can see there are only marginal differences between the teams. Cardiff, Derby and Sheff Wed create a similar number of Great Chances (~1.5/1.6 per game), but Wednesday convert them at a much better rate. While this may be expected to decline, the small number of games remaining means that this is unlikely to happen before the end of the season.
Sheffield Wednesday actually have the best conversion rate across two of the three categories, which is a big reason for why they are the second highest scorers in the league (behind leaders Burnley). This is a real change from last season when they scored the fewest number of home goals in the division – even less than the bottom three.
Derby’s Great Chance conversion rate is the lowest of the group, but they make up for this by not only having the highest conversion rate of Good Chances, but also creating many more of these than the other sides. Ipswich’s rates are also quite good, though not at the level of Wednesday and Derby. This could be an indicator of some quality in their shooting but it could also be an indicator of an uncontrollable luck factor too.
Defensively, it is again Derby who look most impressive, giving up the lowest number of Great and Good Chances, with a low conversion rate on those Good Chances as well. Wednesday also seem to be skilled at preventing chances but the conversion rate on the Greats shows that if they concede one there is almost a 50% probability of it being scored. Naturally, preventing these situations is a must for Carvalhal’s men, but fortunately for him he has a solid defence.
Another thing to consider here is the fair outcome for each team in the table, which is basically StrataData’s “fair score” of their games. This is based on various metrics and is designed to show that if a team were to play the same game 100 times in the same situation would they be more/less likely to get something out of it. These scores are then added up in the same way a league table would be and the top four is quite representative here:
Fair Outcome Table 2 DB NOW 1.png
It seems that only Brighton are not truly worthy of their place in the top four, though even by this method they would still be 7th, which is not a big stretch giving the strength of the league. Chris Hughton’s side had a great start to the season, but drew a lot of games that they could have lost on many other days.
Using this technique to observe the four teams we are focusing on reveals a different story:
Fair Outcome Table 1 DB NOW 2
While Wednesday apparently deserve their fifth place, the other teams could be in much different positions in the table. Derby are ranked at the top and this shows that a combination of bad luck and poor form has seen them slip out of the running for the automatic spots. Cardiff and Ipswich look like they may be over-performing, as they are ranked 10th and 13threspectively. This shows that they are grinding out wins that they may not have got on any other day. However, this does not mean they are not deserving of a top six place, but that they have consistently achieved better results than they have been expected to.
This is far from perfect, but provides an indicator of which teams could be over- or under-performing. It is interesting that the other team who deserve to be in the top six is actually Blackburn who sit way down in 16th – while losing Gestede and Rhodes is not easy to cope with they have badly underperformed this season.
Mini League
One final thing to look at is the impact of these teams playing each other. We have already mentioned that there are still a number of games between the sides due before the end of the season. Cardiff have the fewest fixtures against the other teams competing for a play-off place and this could be a benefit, as if they do win when two of their rivals compete they have an increased chance of taking advantage of both dropping points at the same time.
Of course these games are destined to have a significant impact on how the race for sixth finishes up. If Wednesday were to lose their three games against close rivals but win the three other it would likely see a much tighter finish than they would like. As such, picking up points in these matches is key.
Previous results between these teams this season look like this:
Table 4 mini league
As there is quite a difference in how many games they have played against each of their rivals it should be noted that Sheffield Wednesday have picked up less than a point per game against the teams around them. Even with three matches to play this is not a positive statistic, especially when you see that they have also failed to take any wins from the top four sides as well. Derby look understandably strong and with two home games to come they will be looking to further strengthen their position. It is often breaking those teams who look to defend down that has been their undoing, so playing against opponents that might need to go for a win will surely help them.
Who has the edge?
The market has Derby and Sheffield Wednesday as clear favourites (odds as at 6/4/16):
Derby County ~1.08
These prices seem quite reflective of the information that has been covered here so far. As an example, Sheffield Wednesday are likely to need around seven points from their final six games to reach the previously mentioned 75 points. This could be achieved with wins against the two teams in the bottom six that they are due to play, leaving them needing just one point from the remaining four games.
Let’s finish with some rough estimates and assume the following:
1st-4th placed opposition – Lose
This leaves the table at the end of the season as follows:
5th – Sheffield Wednesday (76pts)
There could be some value in Cardiff as they are close to the teams above in the projected final table despite their much longer odds. Indeed, a win for Slade’s team away to Sheffield Wednesday would leave both clubs on 75 points.
We will have to wait until the 7th of May to see how accurate this is but there are sure to be plenty of twists and turns before then. Knowing The Championship, it will certainly be an exciting end to the season.
Dave Willoughby (@donceno)

Wednesday, 24 June 2015

Analysing Managerial Performance - A Follow Up

While working on my previous blog post around ways to look at managerial performance I though the findings of expected points compared to actual points was quite interesting and thought I'd dig into this a little more.

The method behind this is to take the odds provided by Bet365 and give each team a % chance of winning or drawing a fixture. This can then be estimated into how many points the bookmakers think each team SHOULD be taking from a game.

For example for Blackburn vs Ipswich on the final day of last season the odds were

Blackburn Win - 3.3
Draw - 3.5
Ipswich Win - 2.3

This means the chances of each event occurring were as follows (with rounding taken into account)

Blackburn Win - 29.61%
Draw - 27.91%
Ipswich Win - 42.48%

From this we can estimate that Blackburn would be estimated to get at least 1.17 points and Ipswich 1.55 points.

As Blackburn actually won the game they obviously took 3 points (1.83 more than expected), while Ipswich took 0 points (1.55 less than expected)

The table for last season is below - it's amazing how many managers have left since the end of the season! 6 managers are now longer in their jobs - McLaren, Gray, Warburton, Jokanovic, Clark & Redfearn - while I have included Malky Mackay and Ian Holloway as they were in charge of Wigan and Millwall for most of the season.


The table throws up some interesting points

  • It's no surprise to see Eddie Howe and Steve Evans near the top - both have done very well since guiding their respective teams out of League Two and to sustain that into the Championship deserves a lot of credit.
  • Mick McCarthy has managed to work wonders with Ipswich, making the play offs this season against the odds
  • Mark Warburton, Slavisa Jokanovic and Steve McLaren were harshly treated in being relieved of their duties.
  • Alex Neil was perhaps expected to do well although still outperformed the odds - this maybe shows how good a team Norwich and when he took over.
  • Managers such as Stuart Gray and Neil Redfearn who were thought to have done exceptionally well maybe didn't perform as good as the bias expected - they were marginally better than Russell Slade who Cardiff wants would like sacked!
  • Chris Hughton and Steve Clarke took over in mid season and continued to struggle despite the bookies expecting them to turn it around
  • It's clear why Malky Mackay and Ian Holloway were sacked - though interestingly both have positive away Expected points totals.
Looking at Norwich I wondered what the previous managers records looked like, especially with so many changes in the Championship so below is the record of every manager from last season


It's clear there's a lot more underperformance in this table, reflected by the lack of managers who achieved a positive difference in results. Of the ones that did 2 managed Watford!

  • Maybe Adkins and Peeters were rather hastily dispensed with by their clubs, though both were suffering a downward turn in form at the time.
  • Uwe Rosler is surprisingly low, he was excellent for Wigan in 2013/14 and it shows how bad they underperformed last season compared to expectations.
  • Norwich were the case in point and Neil Adams massive underperformance despite leaving them just outside the play offs in January shows that the bookies expected them to be one of the best sides in the division.
  • Sami Hyypia managed to wrack up an incomprehensible under performance in such a short space of time

While none of these findings are conclusive due to the small amount of games played and large volume of variance from game to game it's interesting to see which managers are perceived to be doing better than others.


Friday, 19 June 2015

Is it better to be direct or retain possession in the Championship?

Football is a game of many styles. While most fans would love their team to resemble Barcelona or Arsenal on a week to week basis it's just not possible mainly due to the skill level of most sides, especially the lower down the leagues you go.

The Championship has a reputation for being blood and thunder, very little skill and teams just 'hoofing' it down the pitch with little thought to keeping the ball.

But is it?

I wanted to look at whether teams who kept the ball better do exist in the Championship, and if so do they tend to do better than sides that play more direct.

I wanted to look in particular at a few things (all info using WhoScored), which teams played the highest percentage of longer passes compared to their total passes, were teams who are better passers of the ball generally able to play more accurate longer passes, where did the teams finish depending on their style.

Unfortunately as with all statistical data there are some provisos - The stats just show the number of passes so these are unrelated to goalscoring in anyway. A team could play 10 short passes across the back line before going long in 1 pass and it puts the striker through on goal - is that team a possession based game or long ball? The stats would show that they make 10 short to every 1 long pass - indicates a possession team even if their chances are created via longer passes.

The table below shows which teams play short/long passes as a percentage of their total passes.

Table showing % of Short/Long passes by team in the Championship 2014/15


The table clearly shows that the teams that play more short passes finish higher up the table. This is a common theme throughout the divisions as teams who are better at keeping the ball tend to create more chances - the obvious exception to this is Ipswich, who are ranked as the team playing the highest number of long passes compared to short but finished 6th in the league.

There are other anomalies such as Brighton being well down the league and also Fulham despite a passing style and Derby were the number 1 short passing team despite dropping out of the play offs on the last day.

While the number of long balls played could be a particular way of playing, how did the teams create their chances? We can see in the table below (click on the table to enlarge)

Table showing style of Key Passes made and difference to Total in Previous Table
Interestingly, most of the teams at the top created more chances as a % of their long passing than they did by their short passing, although most of the margins are quite small. Derby are interesting to note as they had the highest positive difference, despite being top of the previous table. So even though they played the highest percentage of short passes, when they did go long they made very little chances, which could be a sign of a team without a back up plan.

The teams down a the bottom, who tended to play a lot of longer balls, created more chances via short passing perhaps a reason they failed to deliver consistently as they persisted with a more direct game despite not creating as much from the longer passes they did play.

While these are just a couple of simple tables and don't give any clear definitions on a 'best' way to play it's clear that the better teams are able to do both, passing short to retain the ball but able to create chances via more than 1 method.

How do the Championship teams compare to the Premier League? Is the Championship really just constant long balls where the Premier League is beautiful?


From this table it's clear the teams in the Premier League play a much clearer passing  game - Derby, the team with the largest % of short passes to long passes in the Championship, would only be ranked 9th in the Premier League.

What is interesting is when we compare the top 8 in the Championship, who were much better than the rest of the division, and compare them with the bottom 8 in the Premier League, who spent most of the season battling to survive.


The table shows that 6 of the top 9 teams were from the Championship, with Bournemouth, Watford and Norwich all firmly in this section. Will they still play the same style when they are scrapping to stay up? It will be interesting to see if Bournemouth stick to their principles but this is another indication that maybe the Championship isn't quite as direct as it's made out to be.


Thursday, 17 October 2013

Poisson Betting - September Update


Just a quick update to how the Poisson betting is going (Slightly more delayed than I would have liked – these results are to the end of September)

There has now been a total of 1,569 games to bet on and a total of 23,708 different bets.

The total which my sheet has predicted correctly has held pretty steady, increasing by 0.92% to 65.38%

The top 3 Leagues for results being predicted correctly are Scottish Premier League, French Ligue 1 and Serie A– all with over 70% of bets correct.

The lowest 4 are the English Premier League, League One and League Two along with Serie B – all are around 61%

The 2 Leagues that have shown the highest increase are Spanish La Liga and the English Conference – both increased by around 5%

The largest drop was the Portuguese Liga which dropped by 6.5% - no other league decreased by more than 2%

Table below showing some of these results.


Couple of things I’m working on to improve the usability of my sheets in the short term:-

  • Coding some of the macros so they run faster
  • Instead of having to choose the individual teams each time I’m working on a fixture list which would run all the macros with 1 button click
  • Working on tightening up the ratios when teams have been promoted and relegated – I’m preparing another blog post on this
  • Looking at areas where teams are predicted to win with better odds than the bookies are offering


I received a couple of comments last time I posted an update – if you have any advice or feedback on how I can improve these, whether you are doing something similar or just noticed something I may have missed please feel free to comment and I’ll respond when I get chance!

Thursday, 5 September 2013

Poisson Betting - August Update


Here is an update on how my Poisson Distribution is going so far this season. This covers the whole of July & August

If you missed it, I talk in an earlier blog post about my motive behind this but below are the 19 separate bets across the 23 different leagues that I have analysed

For each game I predicted:

  • Which team would win or if it would be a draw
  • Double Chance (Win/Draw for each team)
  • Score Prediction
  • Both Teams To Score (or Not)
  • Over and Under 0.5, 1.5, 2.5, 3.5 & 4.5 Goals per game (10 separate Bets)
  • Corners – Under 10, 10-12, 12+ (English Prem – L2 only)
  • Cards Predicted – Under 4, 4-6, + (English Prem – L2 only)
  • Red Card – Yes/No (English Prem – L2 only)
  • Home & Away Cards Predicted (Under 2, 2-3, Over 3) (English Prem – L2 Only) – 2 Separate Bets

 The Table below shows the success rates across each League

I don’t think the results are too bad but time will tell whether these could have been achieved purely by guessing rather than statistical prediction. It’s early days for some of the leagues so the results will fluctuate over time. The breakdown of the ratios for each division is below.


I will update the scores again at the end of September and so forth on a monthly basis.


Tuesday, 2 July 2013

Do Goalkeepers Raise Their Game Against Big Clubs


Goalkeepers are traditionally very hard to analyse. There are understandably less statistics produced due to goalkeepers generally having less actions during a game, although the modern day goalkeeper needs to have added excellent distribution to his repertoire to effectively play as a sweeper. The limitations of the available statistics is probably for another post but the obvious one is whether a shot should be expected to be saved. Paul on his Different Game blog has already explored some excellent work on goalkeepers

Joe Hart was in unbelievable form during Manchester City's title winning season


From a throwaway line I heard on Match of the Day some time ago, I decided to investigate the impact playing against better teams had on keepers. In essence are performances like John Ruddy away at Liverpool for Norwich in securing a point reflective of their performance over the season or are they “one offs”.

Using the MCFC analytics data, which is now unfortunately a season out of date (here’s hoping they continue to release updates on a better than annual basis although the project does seem to have died a death) we have access to a full seasons worth of data using statistics provided by Opta. By working out how many shots each team face on average we can see whether the % they save is higher or lower against the ‘big 6’ (in this case I have used Man Utd, Man City, Chelsea, Arsenal, Spurs & Liverpool – sorry Everton fans!!)

In all 44 Goalkeepers played during the 2011/12 season for the 20 Premier League Teams and the first thing I looked at was how shots & goals affected the final league position.

It’s clear from the graph below there is a reasonable correlation between the number of shots faced and where teams finished (R Square is 0.6484). It’s common sense that the more shots teams have at you EVENTUALLY one is likely to go in, so conceding less shots initially should result in conceding less goals. Using Shots Conceded is effectively half of the Total Shots Ratio Model in reverse as with that model the percentage which you outshoot your opponent has a high relationship with finishing position – it means that if you concede less shots you are much more likely to be able to outshoot your opponent and ultimately finish higher.

Graph showing total shots faced vs final league position for 2011/12


The second graphic shows the number of goals actually conceded and is an even better fit, with an R Square of 0.7027. There are some outliers here (Sunderland conceded as many goals as Arsenal but there were 10 places between them – it’s OK not conceding many but you do actually have to shoot and score sometimes!)

Graph showing total goals conceded vs final league position for 2011/12

So knowing this I go back to my original point and whether some goalkeepers are able to raise their game against the big boys.

I chose a cut off of 1350 minutes (15 games) to look at, which gave me 22 goalkeepers. The gap between Thomas Sorenson (1350 minutes played) and the next 3 keepers in total minutes (3 at 720 minutes) was reasonably large anyway and a good place to cut.

First to look at is the total number of shots on target (excluding penalties) each goalkeeper faced. We can see from the simple table below which keepers immediately stand out.


Minutes per shot on Target

Minutes per Goal Conceded


Minutes per Goal conceded vs Minutes per Shot Faced


Immediately Joe Hart stands out as much better than the rest (remember, this is 2011/12 data so his dip in form last season is not taken into account) whereas at the other end Adam Bogdan and Jussi Jääskeläinen are both in the bottom 4 keepers in terms of the lowest number of minutes per goal conceded. This goes some way to explaining why Bolton were relegated.

So where it was taking just 2.5 shots on target to beat Paul Robinson it was taking twice this many to score past David de Gea. Not bad for a keeper who supposedly had a poor first season!


David de Gea is now proving to be the top class Goalkeeper he was signed to be


I’ve now compared the figures against the previously mentioned big 6 against the other teams. For this I have removed Sorenson, Jaaskelainen, Begovic and Bogdan due to them not playing enough games against the better teams. I set a minimum of playing at least 2/3rds of each of the games against the big 6 and the other 13 to give a reasonable representation.

Minutes per shot faced - Big 6 vs Other 13


In all cases the big 6 shot on target more frequently than the other 13. This was pretty much to be expected as you would expect the better teams to produce goal scoring opportunities more frequently than lesser teams.

Shots per goal conceded - Bg 6 vs Other 13


This is where it gets interesting, there is no clear distinction showing keepers raising their game against better teams. Michel Vorm, Simon Mignolet and Mark Schwarzer all have excellent records against the big 6 and along with Paddy Kenny all actually conceded less goals per minute against the better teams than the others in the league.

Joe Hart is also in there, and although his record is good in both cases it’s better against the better teams, maybe a lack of concentration in the less important games due to being so well protected?

David de Gea and Brad Friedel come off worst, de Gea’s phenomenal numbers against the other 13 teams (Man Utd always seem to have an exceptional record against teams lower down the table) was always likely to drop against the better teams, but it remains as one of the better ones in the league. Brad Friedel shows a big drop and maybe the 5-1 home hammering Tottenham took by Man City (remember Dzeko’s 4 goals??) from only 9 shots on target skews the data and shows the fragility of how one result can affect this.

Unfortunately these statistics only show the tip of the iceberg. Is there a reason for keepers performing better against better teams? They are likely to have more defenders in the box making the shooting opportunity not as clear, maybe they take shots from further out. All this is speculation and until further detailed information is available speculation is all we have.

Another goal flying in past Paul Robinson